Everybody gets this wrong about bar charts!
1 min read
😱 So many people get this wrong about bar charts!!! 📊
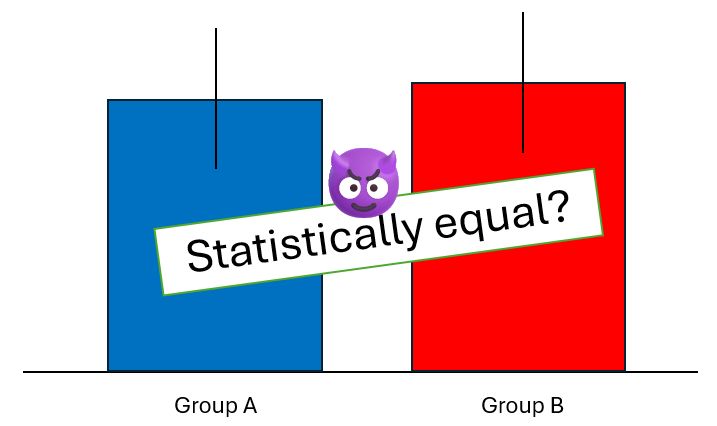
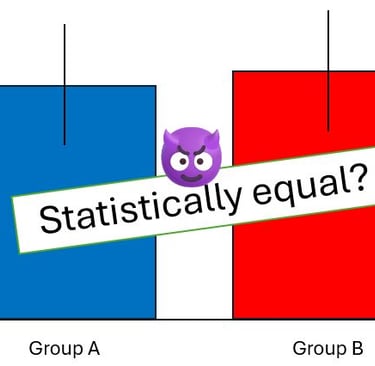
🎯 Just because error bars overlap, this doesn't mean the bars are statistically equal!
Take this example where error bars represent confidence intervals:
🔹 Group A: Mean = 100, Standard Deviation = 10, Sample Size = 40
🔺 Group B: Mean = 105, Standard Deviation = 15, Sample Size = 80
The confidence interval (CI) for each mean are:
🔹 Group A: CI = [96.9 ; 103.1]
🔺 Group B: CI = [101.7 ; 108.3]
👉 These Confidence Intervals overlap between 101.7 and 103.1, which is over 20% of the length of either interval.
This seems to suggest that the means are not statistically different.
HOWEVER
If we run an independent sample t-test assuming unequal population variances to compare both population means, we get:
t statistic = -2,16 (df = 78)
p-value = 0,03 😱😱😱
👉 At 5% significance level, we reject the hypothesis that the means are the same -- even though their confidence intervals overlapped!